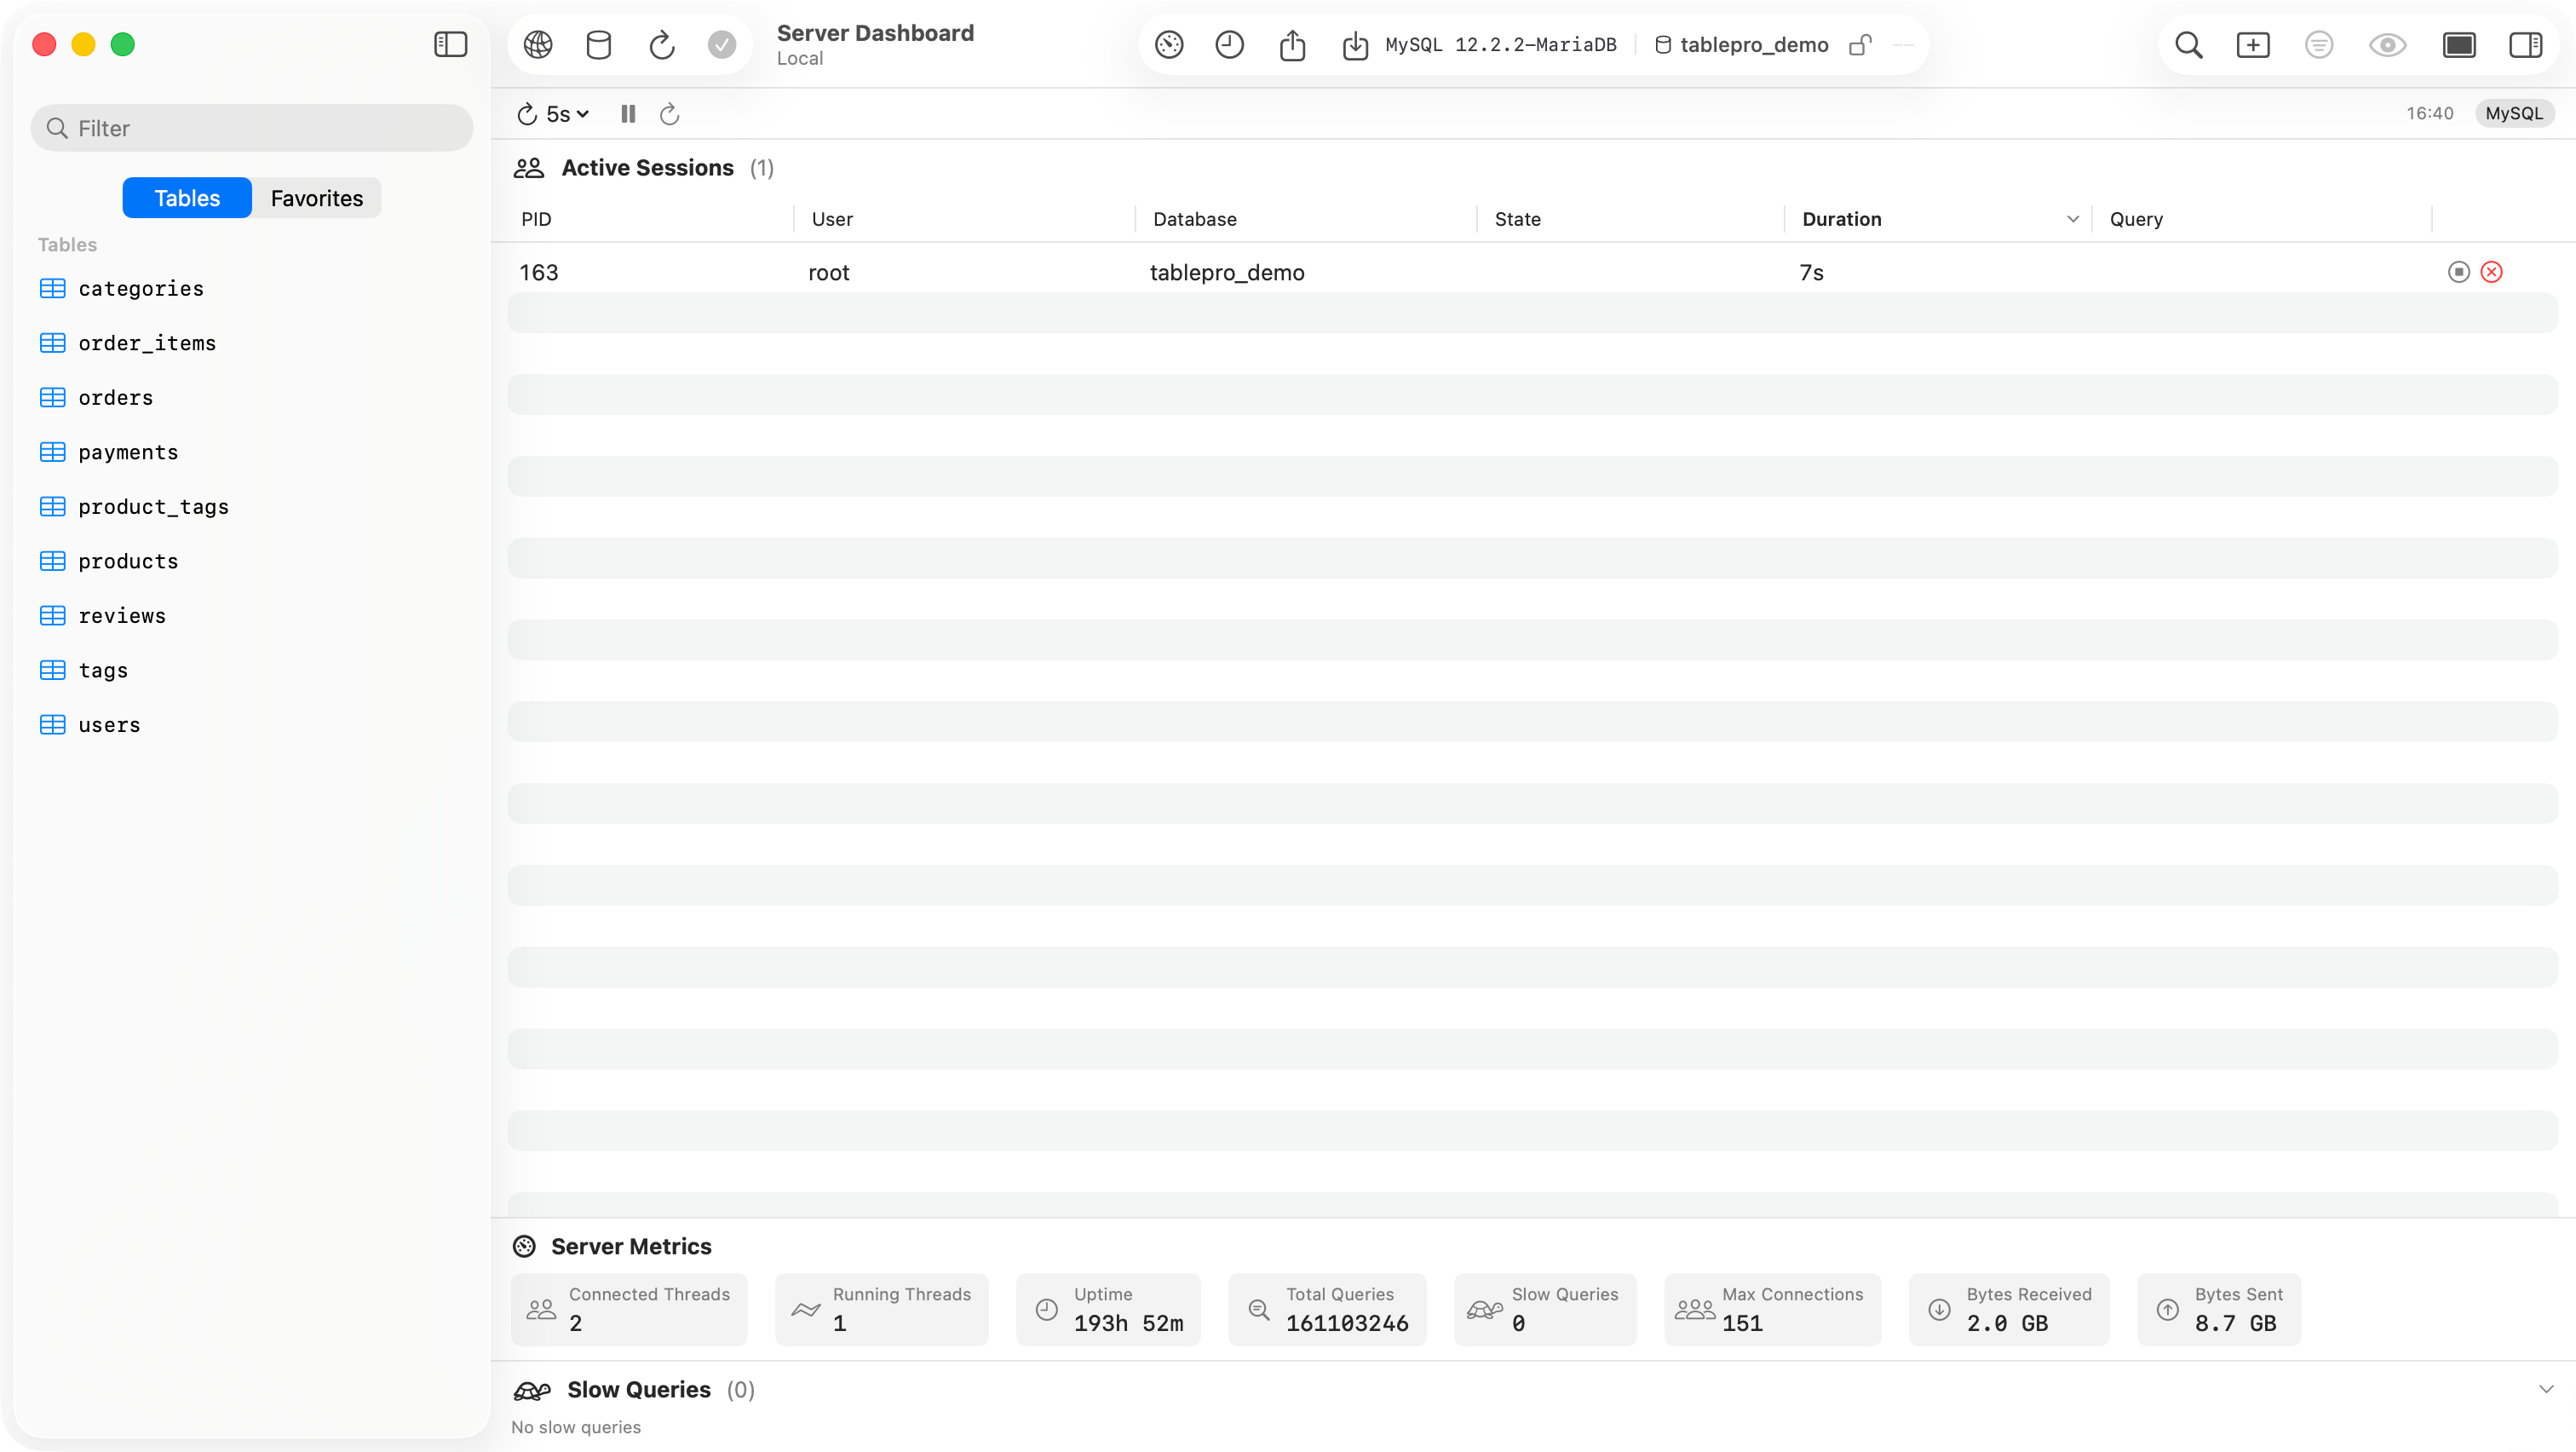
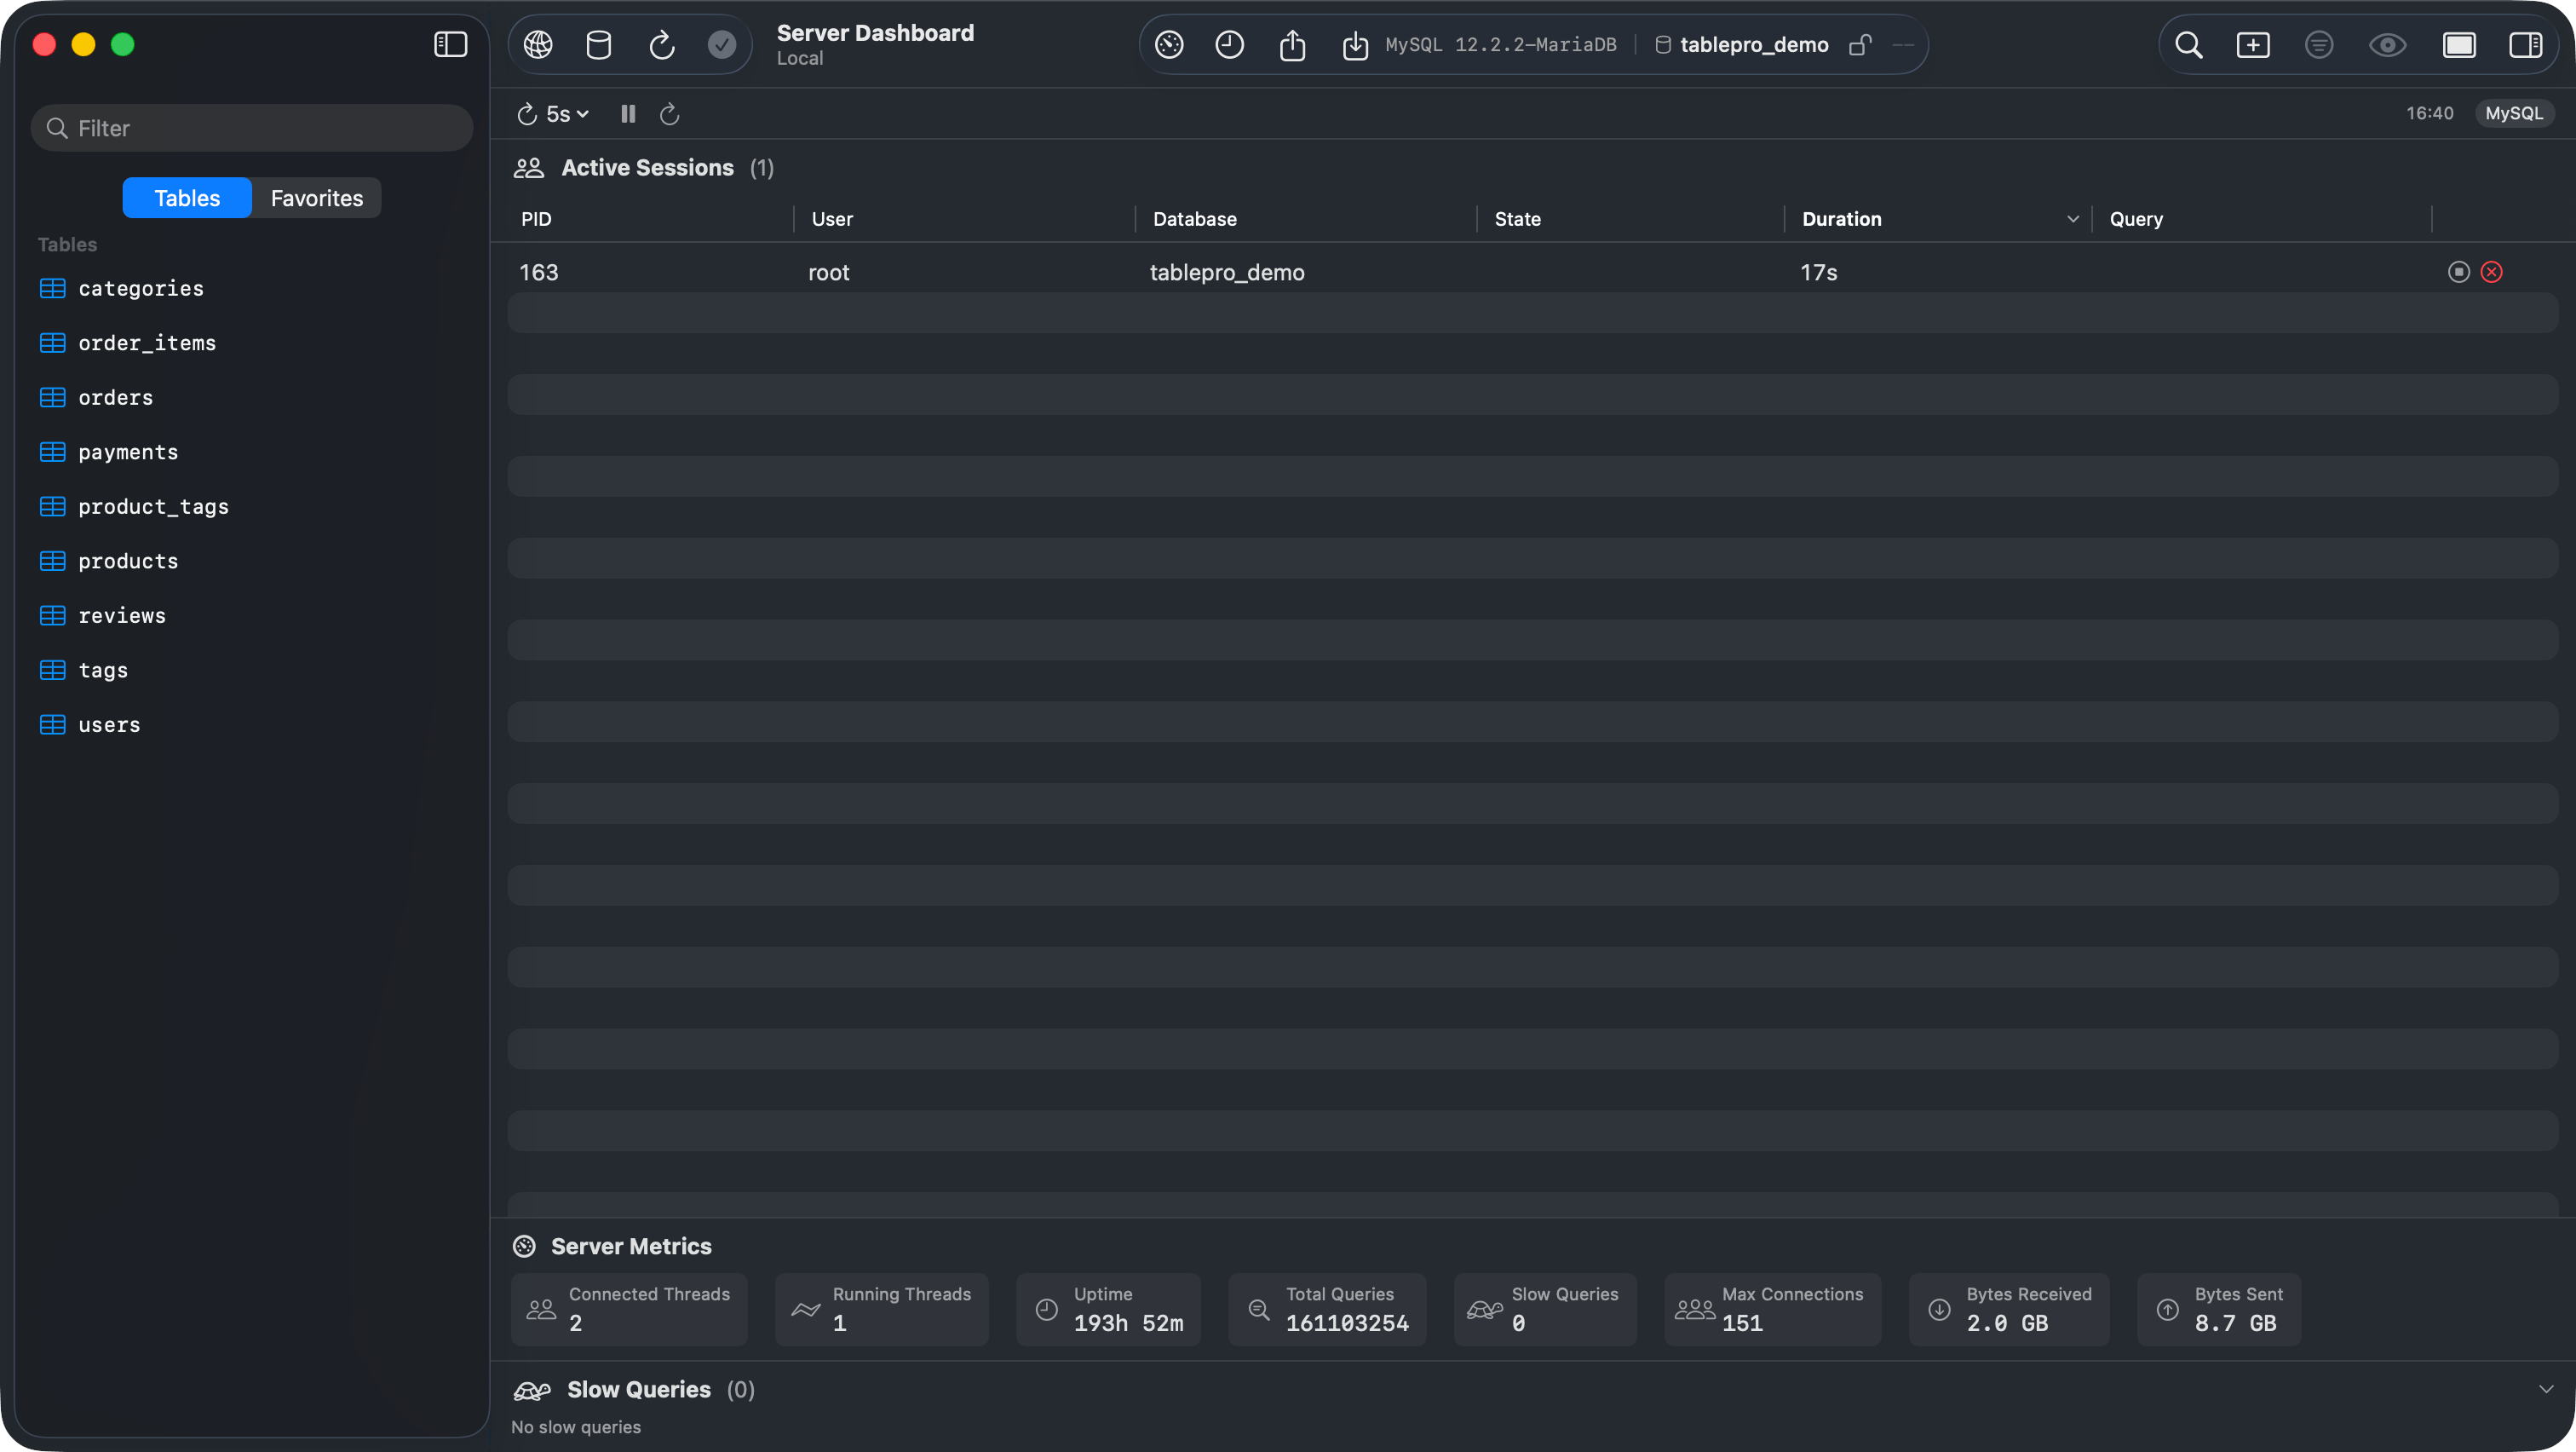
Server Dashboard showing active sessions, metrics, and slow queries
Active Sessions
A sortable table of all connections to the server, showing:- PID: process or session ID
- User: connected user
- Database: target database
- State: current status (active, idle, sleeping)
- Duration: how long the current operation has been running
- Query: the SQL statement being executed (truncated, hover for full text)
Kill and Cancel
Each session row has action buttons:- Cancel Query (stop icon): cancels the running query without terminating the connection (
pg_cancel_backendon PostgreSQL,KILL QUERYon MySQL) - Terminate Session (x icon): kills the entire connection
Server Metrics
A horizontal strip of metric cards. What is shown depends on the database:Slow Queries
A list of queries running longer than 1 second, sorted by duration. Each entry shows the elapsed time, SQL text, user, and database. ClickHouse is different: the list comes fromsystem.query_log, so it shows the 20 most recent finished queries that took over a second, newest first, with no database.
Auto-refresh
- Interval menu: 1s, 2s, 5s (default), 10s, 30s, or Off
- Pause/Resume: stops refreshing without changing the interval (disabled when the interval is Off)
- Refresh Now: runs one refresh
- Last refresh time: shown on the right
Database Support
For databases without a dashboard provider (Redis, MongoDB, and others), the menu item and toolbar button are disabled.